The 30 minute chart below of SPY, the SPDR S&P 500 ETF shows this year's Santa Calus rally. Don't fight the market and especially don't fight with Santa.

| Simple Trading Ideas |
|
|
The 30 minute chart below of SPY, the SPDR S&P 500 ETF shows this year's Santa Calus rally. Don't fight the market and especially don't fight with Santa.
0 Comments
The chart below shows that $NYA, the NYSA Composite Index is moving higher and $NYMO, the NYSE McClellan Oscillator is moving lower. This looks like a bearish developement. There was a similar bearish divergence back in May and July as you can also see on the chart. 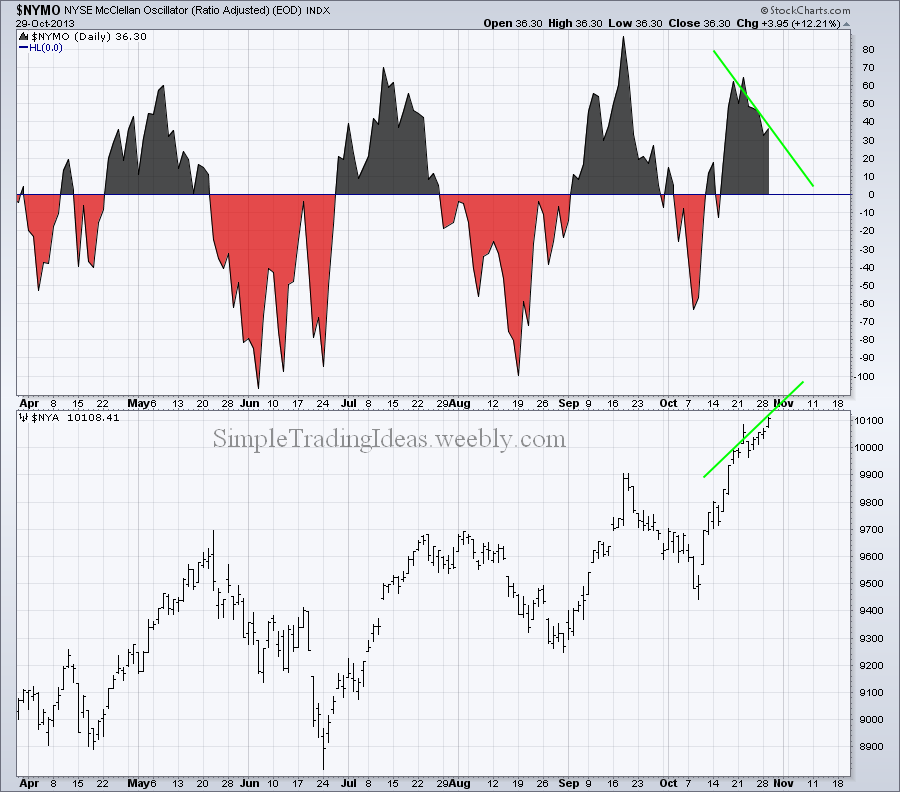 $TRIN is the New York Stock Exchange short-term Trading Arms Index. It is a breadth indicator and is calculated from the AD ratio divided by the AD Volume ratio: (advances / declines) / (up volume / down volume) Low readings, below 1 show relative strength and high readings, above 1 show relative weakness. $TRIN can be used to detect overbought/oversold conditions. The chart below shows $TRIN. Notice how it dipped below 0.5 which is considered overbought.  MFI the Money Flow Index is a momentum oscillator calculated from both volume and price. The calculation is similar to the calculation of RSI the Relative Strength Index. For this reason it is also called the volume-weighted version of RSI. Theories suggest that volume leads price and also RSI momentum oscillator leads price. Including volume in the calculation can increase this lead time. The weekly charf below shows DIA the SPDR DJ Industrial Average ETF with MFI below the chart. Notice that DIA recently slightly moved lower but MFI failed to reach new lows. I consider this a bullish divergence. We will see the development of this divergence in the next couple of weeks. 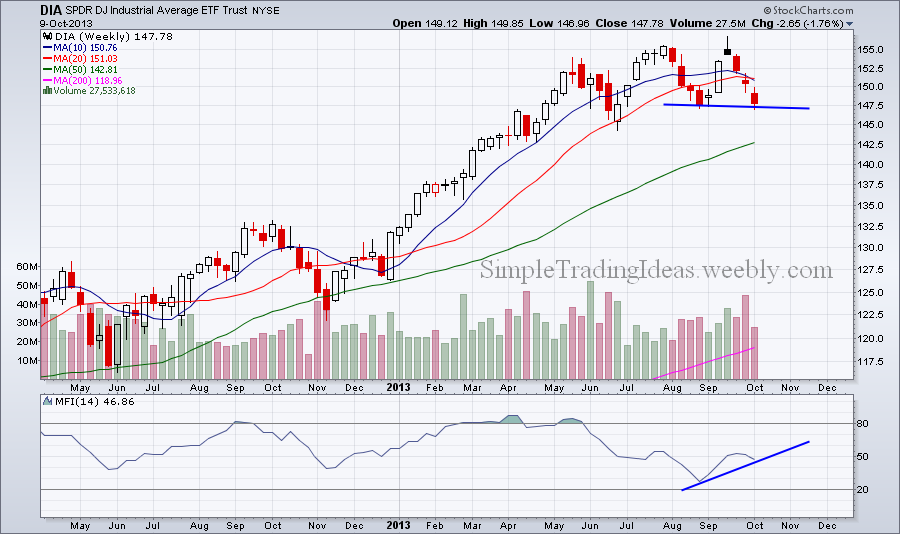
IWM the Russel 2000 iShares is representing the small-caps. Although it holds up better than large-caps as I mentioned in previous posts it is losing momentum. Notice on the chart below that it failed to reach the upper channel before starting to trade sideways and MACD crossed below the signal line. 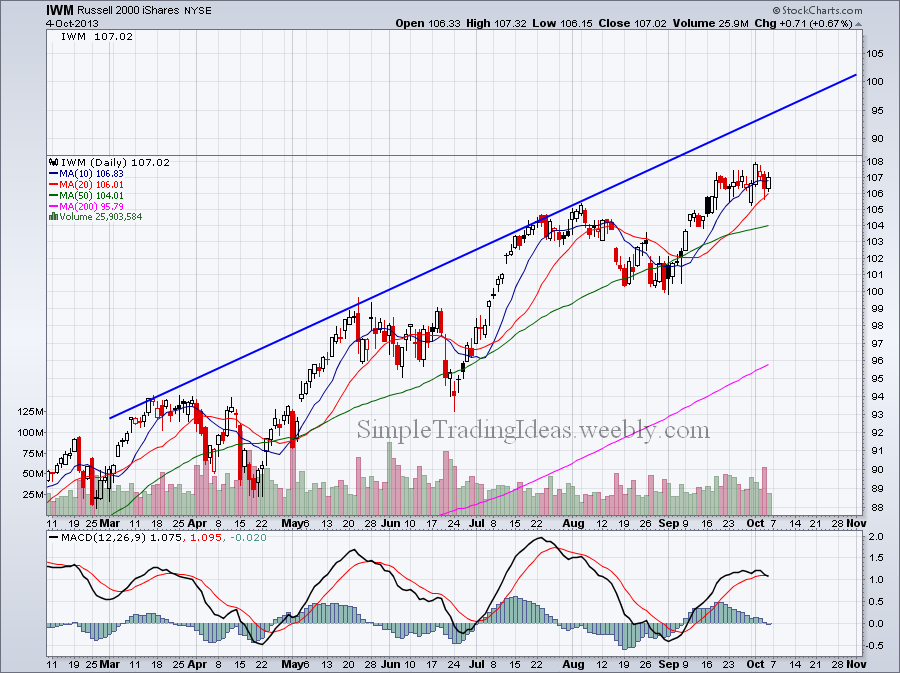
$NYMO, the New York Stock Exchange McClellan Oscillator is in negative territory which is bearish. $NYMO is a breadth indicator and is calculated from Net Advances on the NYSE. When $NYMO is negative declining issues are dominating. $NYMO works similar to MACD it puts momentum into the Advance-Decline Line. 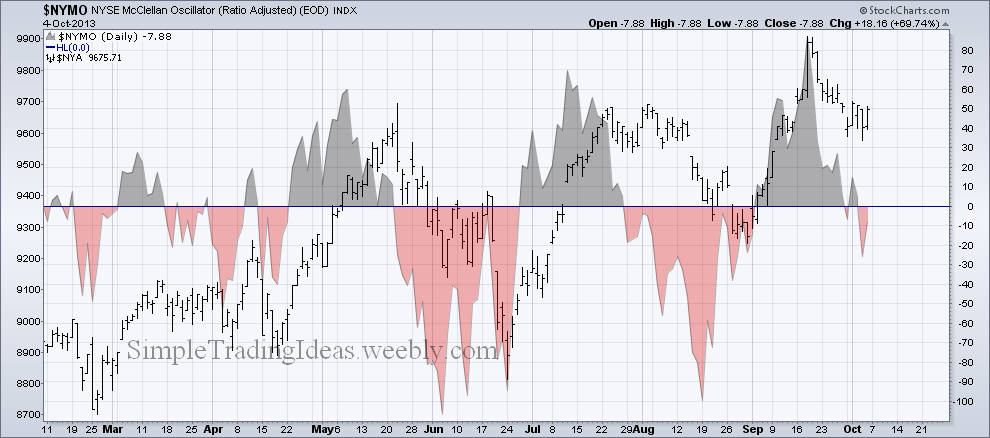 The "fear index" suggest that investors feel comfortable with the general market. From the chart below it looks like VIX will go even lower. The TRIX momentum oscillator and Aroon trend indicator reinforces this observation.  The chart below shows the declining volume relative to the total volume on the New York Stick Exchange with the 20-day and 50-day EMAs. Both moving averages are above 0.50 which means that more than 50% is the volume is declining. The actual number for Friday was 0.71. The background shows $SPX but $NYA the NYSE Composite Index would be similar. 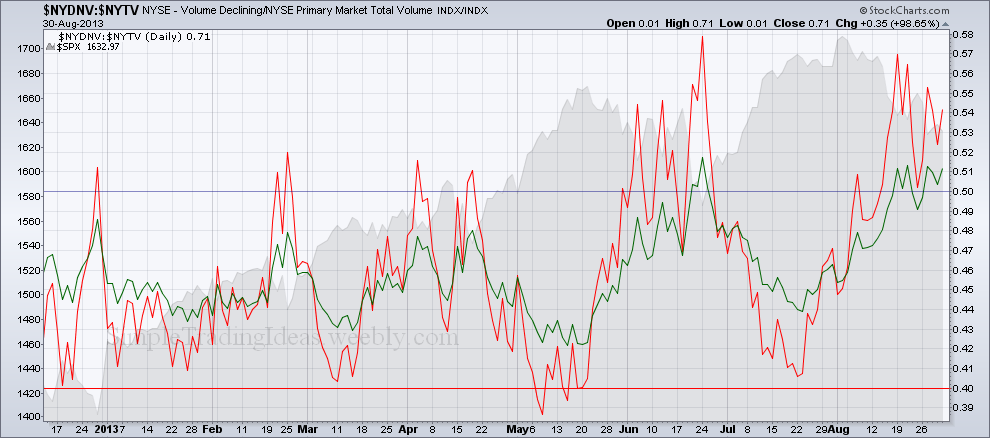
The chart below shows CPC, the Total Put/Call Ratio with a couple of indicators below that. The first one is TRIX a momentum oscillator similar to MACD. The Main difference is that TRIX is triple-smoothed and is calculated as follows:
The TRIX indicator below shows that it crossed above its signal line which is bullish for CPC but not as much tor the stock market. What it means is that options traders are increasingly buying puts. The correlation between CPC and S&P 500 is mostly negative as you can see on the third indicator. 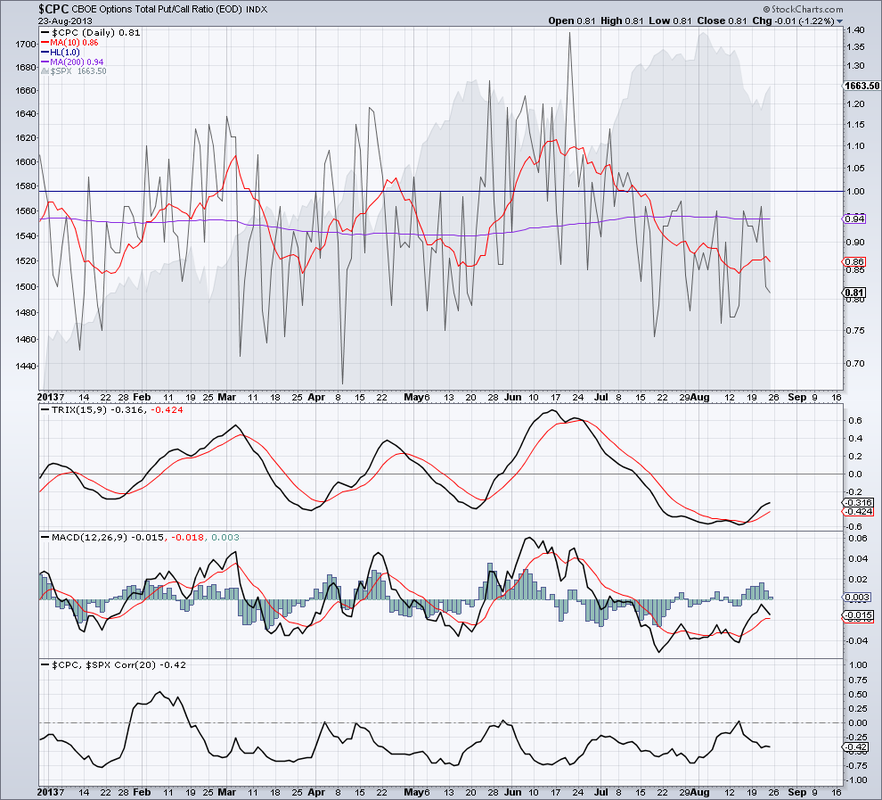 SPY moved higher in July and August but the 14 period RSI and StochRSI failed to move higher. 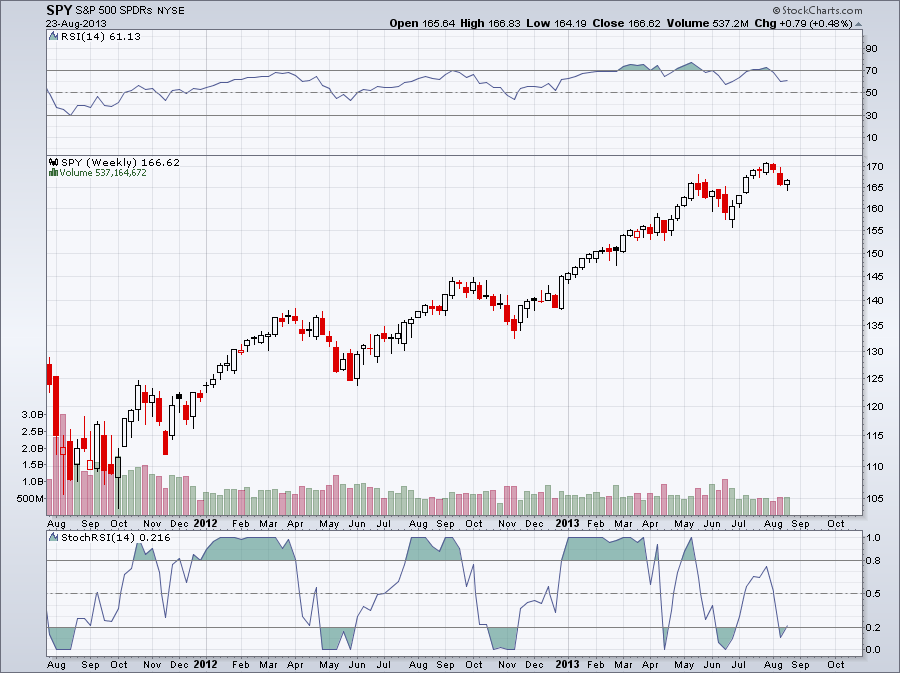 |
Loading
Search Site
Links
Archives
September 2014
Categories
All

|
 RSS Feed
